You said, we did: VLE analytics upgrades


Following a three-month project led by the Mindful Education technology team, we’ve rolled out a number of upgrades to the analytics that underpin all of our virtual learning environments (VLEs), including a fresh new look.
The upgrades are part of our ongoing improvements process, and include suggestions from our partners who use the analytics regularly to support learners. Our aim throughout has been simple: ensure that our analytics remain intuitive, so tutors and managers can find the information they need quickly so they can plan their on-campus sessions with ease.
A clean, intuitive design
We’ve reorganised our analytics under five clearly labelled tabs, each with its own visually recognisable icon: Group Overview, Group Dashboard, Group Video Data, Learner Engagement and Learner Timeline. Group overview is now the first thing tutors see, and the learner timeline has been put into its own tab for easier navigation.
We’ve also applied the Mindful Education brand across all our analytics, so it’s clear that this is a tool built and maintained by our in-house team – not a bolt on. Updated copy throughout every widget clearly explains what each piece of data means and how to use it, making the analytics easy to use from day one.
New features built from your feedback
Several of our upgrades came directly from suggestions from tutors:
- Learner activity log: a brand new, per-learner record of every page, questions and video interaction, including revisits, filterable by date range. It’s an ideal way to see exactly what a learner has been revising ahead of an assessment
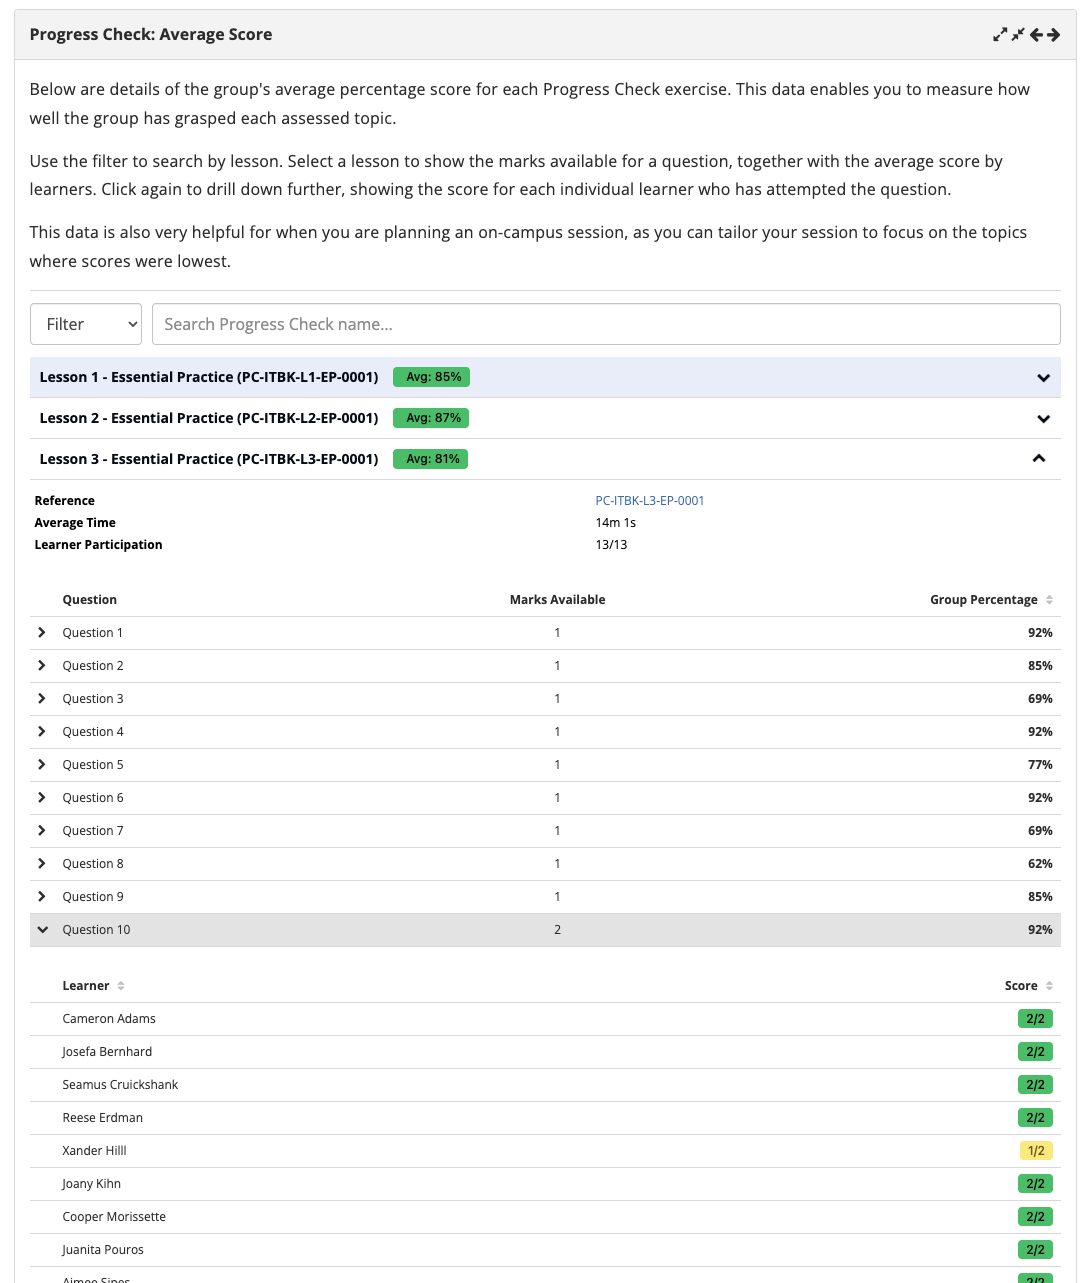
- Progress check widget: we’ve replaced the separate plugin view with an all-inclusive widget on the Group dashboard, so tutors now only need to check one place to get a full overview
- Smarter date filtering: we’ve integrated the date filter into the learner progress overview widget for easy use
- Per-group PDF export: running a report across multiple groups now downloads as a single ZIP file, with one PDF per group
- Easy-view SEN details: hovering over a learner’s surname on the Group overview page now reveals their SEN information at a glance
Clear results for every learner
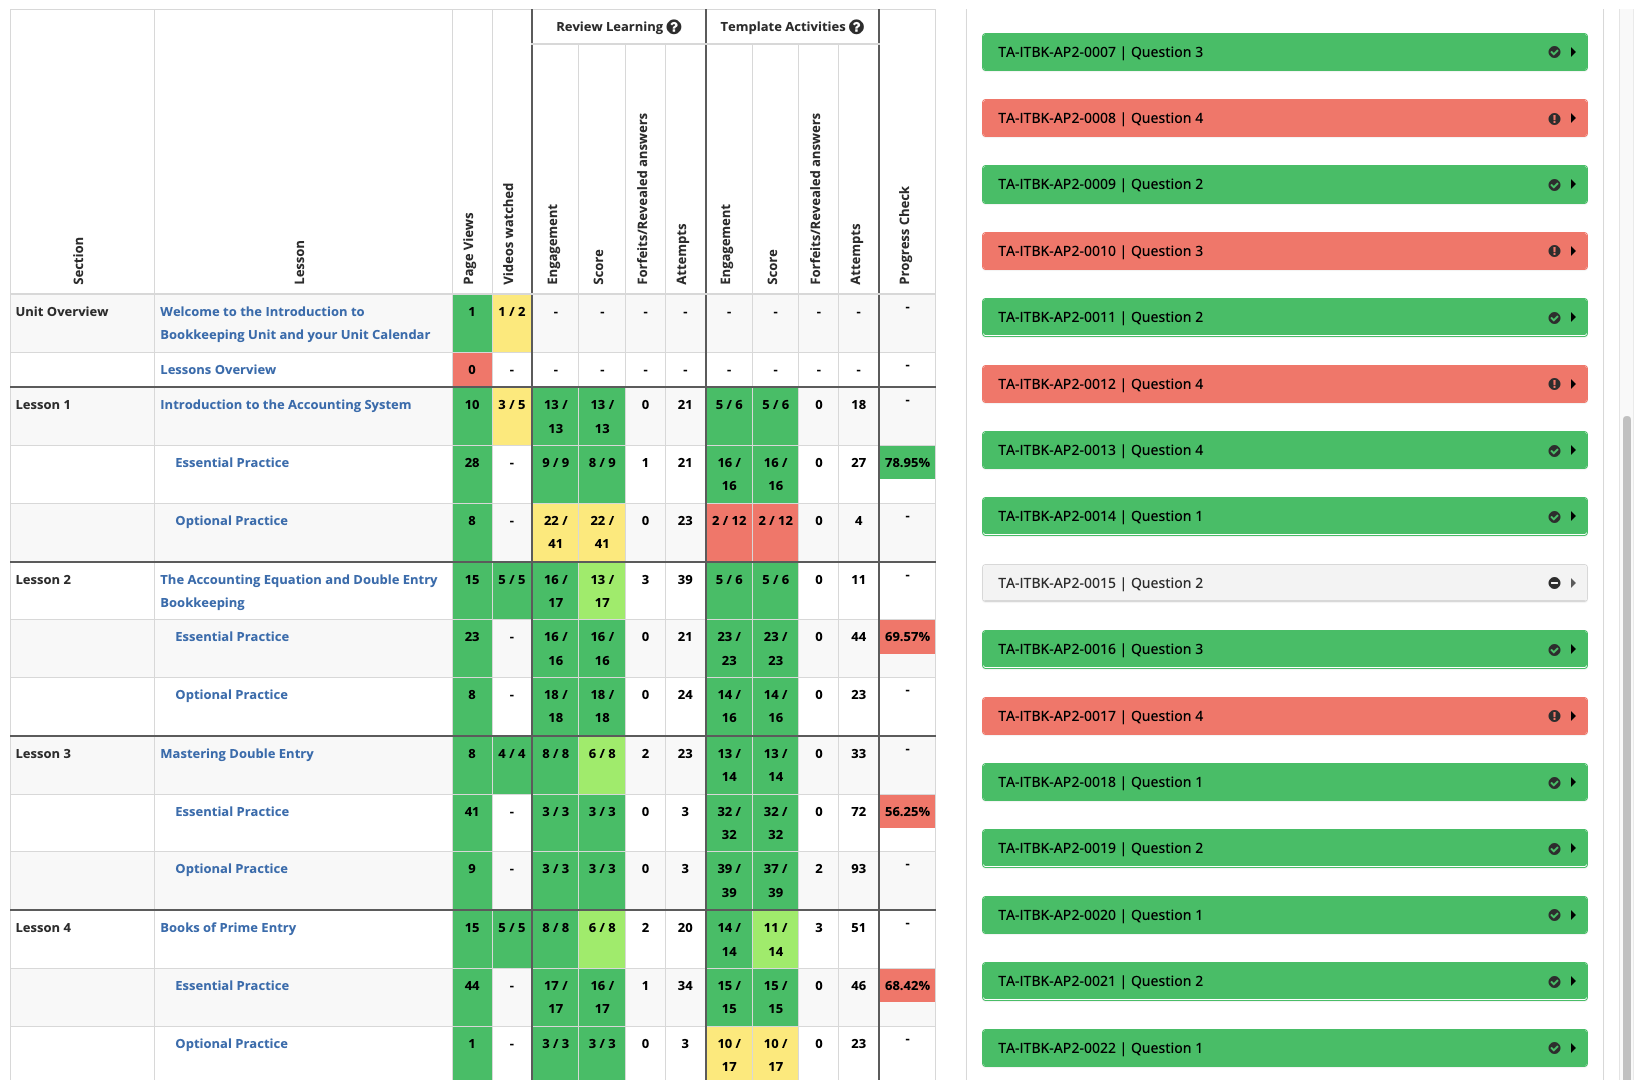
Every section in the Learner engagement drilldown now opens as an accordion, so you can quickly see a learner’s work engagement and performance without having to click into each question.
Progress check results are now marked as a pass or fail against the quiz’s own pass mark.
The sidebar now follows you as you scroll so question details stay visible throughout.
Together, these upgrades mean tutors can maximise their preparation time ahead of an on-campus lesson, and can quickly access the relevant information when checking in on a learner who might need extra support.
Explore your upgraded analytics
The upgraded analytics have been rolled out across all our VLEs, so the next time you log in as a tutor or manager, take a look around. Many of the upgrades have been shaped directly by feedback from partners and we’d love to hear what you think of the changes.
If you’d like a refresher on how to get the most from the VLE analytics, the Mindful Education Operations team runs regular VLE and analytics training sessions as part of our Mindful Education Insights programme. Alternatively, you can get in touch with your usual Mindful Education contact to arrange bespoke training for your team.
Mike leads the technology team at Mindful Education, responsible for developing and maintaining the Virtual Learning Environment and the systems that support it. His team works to deliver new features and ensure a smooth, reliable experience for partners and learners.